
2:35pm, February 5, 2026. Fifty-four views.
“Financialisation of the economy (impact on the economy of the wealth effect created by inflating asset prices), kicking the can down the road (no political appetite to curtail fiscal largesse) and killing price discovery (repression via QE) are the main culprits and until they’re addressed meaningfully this vicious downward spiral will continue.”
I wrote that in a tweet nobody read. I’m going to spend the next few thousand words arguing that all three culprits have gotten worse since, that a fourth one — the plumbing itself — is starting to crack, and that the people in charge of fixing it are about to do the one thing they keep insisting they won’t.
Here’s the paradox to hold in your head while you read this. In May, the Fed’s new Chair, Kevin Warsh, was talking about a balance sheet $2.5-3 trillion smaller than it is today. By August, the balance sheet had grown by roughly $200 billion in six months. I posted a laughing emoji about it at the time. It wasn’t really a joke. It’s the whole essay in one data point: the man appointed specifically to shrink the balance sheet is presiding over its expansion, and he’s not even the first Fed Chair to do that. He’s the third.
Part One: They’re Already Doing It
Let’s get the mechanics right first, because everything else depends on it.
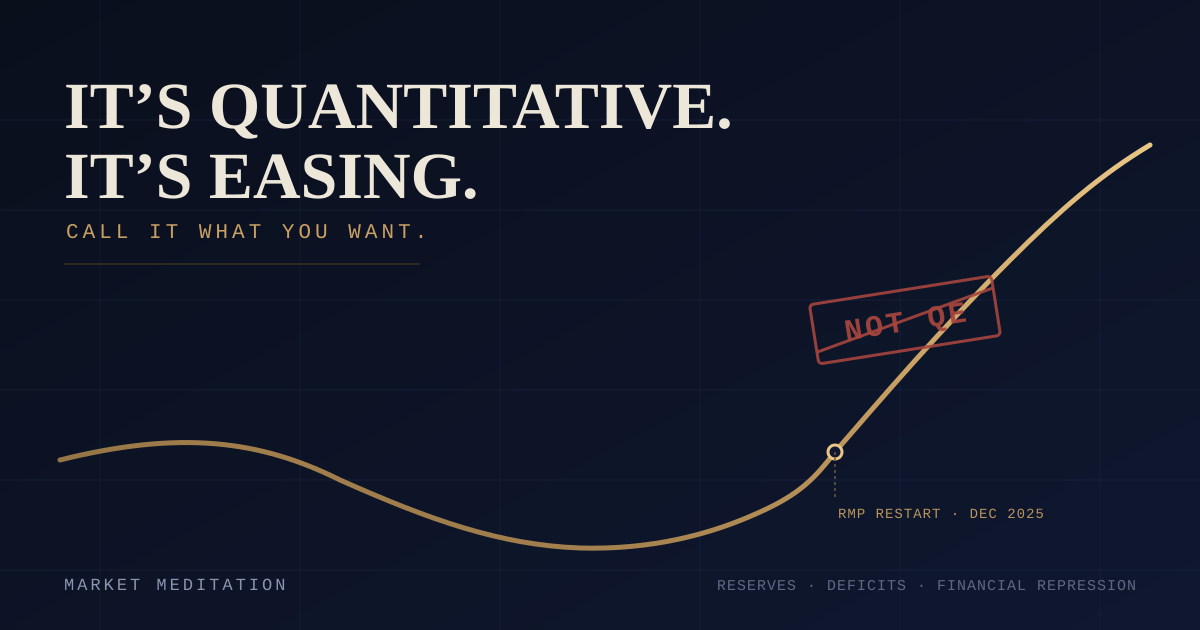
In October 2025, the Fed ended quantitative tightening. In December, it started buying Treasury bills again — “reserve management purchases,” in the Fed’s own language, launched at roughly $40 billion a month and running at an annualized pace that several major banks now peg between $490 billion and $540 billion for 2026 alone. The Fed’s own explanation, published by the New York Fed and repeated at every press conference since, is that these purchases are intended “to support interest-rate control and smooth market functioning” and are explicitly not a change in the stance of monetary policy.
Let’s take that claim seriously, because it’s not wrong on its own terms. Reserve management purchases are short-duration. They’re not targeting long-term yields. Arguably, they’re not trying to compress the term premium to juice asset prices the way the 2020 vintage of QE openly was. There’s a real, defensible, technical distinction between adding reserves to keep plumbing functional and adding reserves to stimulate the economy.
There’s a specific, documented channel worth naming here, not just the abstract point about reserves. Joseph Wang — a former New York Fed trader who watches this plumbing for a living — flagged it plainly: increased Fed bill purchases factor directly into how Treasury decides to issue debt. Higher demand for bills, from the Fed and the private sector both, means less pressure on Treasury to issue coupons — longer-dated debt — to cover the same borrowing need. Treasury’s own August refunding statement says as much: it anticipates “maintaining nominal coupon and FRN auction sizes for at least the next several quarters,” explicitly citing SOMA purchases of Treasury bills and growing private-sector bill demand as part of that calculus. Less coupon issuance than would otherwise be needed means less long-duration supply landing on the private sector to begin with — which is, functionally, the same duration-extraction effect QE is built to produce, just reached sideways instead of head-on. gamesblazer06 put the punchline better than I could, replying directly to Wang’s thread: it adds reserves to the system, aka cash liquidity that gets levered and put to work in risk assets.
The distinction doesn’t survive contact with what actually happens when you add reserves to the banking system. Call it whatever you want. Increase the quantity of reserves in the system, that’s quantitative. Ease funding conditions relative to not doing it — and it does, that’s the entire point of doing it — that’s easing. It’s quantitative easing. The only thing anyone is really arguing about is the adjective “large-scale.” Everything else is branding.
And we’ve watched this exact branding exercise before. In October 2019, following the repo market blowout that September, the Fed launched a program to buy bills and rebuild reserves. They called it “not QE.” I wrote at the time that the Fed would have to start real QE to relieve funding pressures — a few months before COVID, when “not QE” became $120 billion a month of outright large-scale asset purchases within about six weeks of the first repo stress giving way to a bigger one.
Not a coincidence I’m forcing. Same mechanism, same clock. Reserve scarcity or funding stress shows up. The Fed responds with a small, technically-justified purchase program. The Fed insists, correctly on its own terms, that this isn’t stimulus. Then something bigger breaks, and the small program becomes a large one, and in hindsight the “not QE” phase looks like the opening act it always was.
In an October 2022 thread, I wrote the sentence I think is the actual thesis of this entire piece, three and a half years before I sat down to write it properly: “All said and done, Treasury market disruption is where the Fed draws the line in terms of pain threshold. They will do whatever it takes to get it back to functioning smoothly if, as, and when needed.”
That wasn’t the first time I’d flagged this particular sleight of hand. In November 2021 — with reverse repo balances still building, months before RRP became a live topic in banking-industry research, back when most market commentary wasn’t paying it any attention at all — I wrote that inducing drainage of RRP would let the Fed keep liquidity stable “while ostensibly tightening.” That’s precisely what happened. RRP swelled to $2.554 trillion by December 2022, then drained by more than $2 trillion over the following three years, fully offsetting the Fed’s own quantitative tightening in net-liquidity terms even as the headline balance sheet shrank exactly on schedule. RRP wasn’t an accident of pandemic-era plumbing sitting around unused. It was the buffer that let “tightening” happen without the system actually tightening — a pre-funded QT — and as of the RMP restart, that buffer is now gone, which is precisely why the plumbing has started needing active help again.
The question was never whether. It’s when, and what specifically breaks first.
Part Two: The Arithmetic Doesn’t Work
Start with the deficit, because it’s worse than the administration’s own numbers said it would be.
July’s monthly deficit came in at $432.3 billion — a record for that month, up 48% year-over-year, the largest single-month shortfall since the COVID relief spending of March 2021. As Lyn Alden put it when the number landed: “While individual months are noisy, one thing remains true. Nothing stops this train.” Ten months into fiscal 2026, the cumulative deficit stands at $1.799 trillion, which has already exceeded the entire deficit for fiscal 2025, with two months of the year still to go. The CBO revised its full-year estimate up to $2.1 trillion — $200 billion worse than its own February projection — citing customs collections running 60% below what it had modeled.
That customs shortfall has a specific cause worth dwelling on, because it’s a clean little parable about how policy promises meet arithmetic. When the Supreme Court struck down the administration’s IEEPA tariffs, Treasury had to start refunding what it had collected. In July alone, refunds ran to $33.4 billion against new collections of about $25 billion — net negative tariff revenue, for the third straight month. Of the roughly $150-166 billion deemed refundable, about $100 billion is already out the door. Tariffs were supposed to be a revenue offset. Instead they’re a fresh hole, and the administration’s pivot first to Section 122 authority and then Section 301 tariffs is a scramble to plug it, not a resolution of it.
Layer the interest bill on top. Net interest paid so far this fiscal year: $931 billion — behind Social Security, essentially tied with Medicare, and comfortably ahead of national defense. Gross interest is running at $1.17 trillion, up 15.5% year-over-year, against total receipts growing about 4%. Interest is compounding at close to four times the rate revenue is growing, and it’s worth being precise about why: if you plot interest expense as a share of federal receipts against the 5-year Treasury yield going back sixty years, the two lines track each other almost perfectly — until 2022, when the interest-expense line pulls decisively above what the yield alone would predict. That gap is the signature of a debt-stock problem stacking on top of a rates problem. It’s not simply that rates are high.
There’s a starker way to see the same thing, and it comes from Luke Gromen’s work rather than mine: “True Interest Expense” — gross interest plus entitlements plus veterans’ benefits, as a share of total federal receipts — is running at 106% through the third quarter of fiscal 2026. Above 100% means the government is printing, in effect, to cover interest and mandatory spending before a single discretionary dollar gets spent. A former Dallas Fed economist has made the case that the US has arguably been in this condition since September 2019 — the same repo spike that opens this essay’s mechanism section. I don’t think that’s a coincidence either. I think it’s the same story, viewed through a different lens.
None of this is temporary in a way that fixes itself. Roughly $9 trillion in Treasury debt needs to be rolled over in the next twelve months alone, and while I agree with Andy Constan that it isn’t really a “wall” at one date, I would characterise it as a permanently elevated mountain, north of $2.3 trillion rolling essentially every month, mostly in bills. JPMorgan’s own analysts, in their most recent refunding preview, project a $3.7 trillion funding gap opening up between fiscal 2027 and 2030 if current auction sizes hold — a forecast Deutsche Bank independently corroborates, expecting the Treasury to start raising coupon auction sizes as early as February 2027. The Treasury Secretary has, so far, held the line on auction size guidance rather than spook the bond market ahead of the midterms. That’s a political choice, not a financing solution, and JPMorgan says as much directly: the current calendar gets Treasury through fiscal 2027 and “not adequate to meet the widening funding gap” after that.
Part Three: Nobody Wants to Hold the Long End
If the fiscal side is the demand for financing, the Treasury market is where you find out whether the supply of buyers can absorb it. Right now, the answer is: less comfortably than a year ago.
On August 13, the Treasury sold 30-year bonds at 5.216% — the highest yield since 2001. The day before, 10-year notes went at 4.683%, the highest since 2007. Bid-to-cover on the 30-year auction came in at 2.39, weaker than the 12-month average, and primary dealers — the banks obligated to show up and buy what nobody else wants — were left holding only 11.5% of the issuance, itself a sign that even the backstop buyers didn’t need to lean in hard to clear the auction. This isn’t a crisis. It’s a market quietly demanding more compensation to hold long-dated US paper, month after month, in a way that shows up in the data before it shows up in headlines.
The curve’s behavior tells you why. The current move — long rates rising while the short end stays roughly anchored — is what’s called bear steepening, and it’s a fundamentally different animal from the bull steepening that normally precedes a Fed cutting cycle, where the curve un-inverts because short rates fall. Bull steepening says the Fed is about to ease. Bear steepening says the market is charging a bigger term premium because it’s worried about supply, inflation persistence, or both. We are unambiguously in the second kind right now, and that matters: it’s real evidence for the fiscal-dominance framing, not a side detail sitting next to it.
Foreign demand is part of the story, though it needs to be stated precisely rather than as a blanket “buyers’ strike.” China’s Treasury holdings are down roughly 50% from their 2013 peak. But total foreign holdings of US Treasuries have actually risen in dollar terms over the same period — the real story is foreign ownership declining as a share of total debt outstanding, because the debt itself is growing faster than anyone’s willingness to add to their position in it. The Fed’s own weekly custody-holdings series for foreign accounts has been in a clean, uninterrupted decline since the Iran war began in March 2026, which is itself worth noting: geopolitical shocks are traditionally supposed to send capital into Treasuries as the safe haven, not out of them.
And it isn’t just a US story. Every developed-market sovereign curve is under similar pressure. Japan’s 30-year yield has gone from roughly 0.1% to close to 4% since 2019; the UK’s 10-year sits near 5%; Germany and France have both moved meaningfully higher too. Japan’s four largest life insurers — Nippon Life, Daiichi, Sumitomo, Meiji Yasuda — are sitting on close to ¥15 trillion in unrealized losses on the “safe” government bonds they’re required to hold, up from almost nothing in early 2024. This isn’t a US problem wearing a US label. This is what happens when every government bond market that spent fifteen years pricing in near-zero rates has to reprice for a world that’s left that regime behind.
Japan is worth walking through in more detail, because it’s the clearest live example of what happens when a government tries to fight this with intervention rather than fix the underlying imbalance — and because the playbook it’s running is a preview of where the Treasury market itself may be headed.
The yen has fallen toward its weakest level against the dollar in roughly four decades, for a straightforward reason: US rates have stayed well above Japanese rates, and investors can borrow cheaply in yen to buy higher-yielding dollar assets. Deutsche Bank’s widely-cited estimate puts the total yen carry trade — including the Japanese government’s own consolidated balance sheet, not just private positioning — at roughly $20 trillion, or 505% of Japan’s GDP; that figure has circulated since 2023 and was recirculated again this month, and it’s worth treating as the upper-bound, broadest-possible framing rather than a precise fresh reading — narrower estimates based on cross-border bank lending alone run closer to $250-350 billion, with some analysts arguing most of that narrower trade already unwound back in 2024. The truth is nobody has a clean number, which is itself revealing: a trade nobody can size accurately is a trade nobody can safely unwind gradually either. On July 31, the US Treasury joined the Bank of Japan in intervening directly in the currency market, selling dollars to buy yen — the first coordinated US-Japan action since 2011. Japan alone burned through an estimated $36.6 billion in a single day defending the currency.
The why matters more than the mechanics. A disorderly yen collapse would import inflation into Japan and destabilize one of the world’s largest bond markets, which is reason enough on its own. But there’s a more direct reason the US Treasury specifically has skin in this game: Japan is the largest foreign holder of US Treasuries, at roughly $1.19 trillion. To fund currency intervention, Japan has to sell dollar assets — and a meaningful share of that is Treasuries. Selling Treasuries to buy yen puts direct upward pressure on US yields, at the exact moment this essay has already established the US can’t afford higher yields. Defending the yen is, in a roundabout way, defending the Treasury market. That’s how much rope the Fed and Treasury actually have here.
It’s also unlikely to work for long, and the Bank of Japan’s own Governor, Kazuo Ueda, has essentially said so: delaying tightening for too long, he’s acknowledged, risks eventually forcing the BOJ into abrupt rate hikes rather than a gradual path. Intervention doesn’t touch the rate differential driving the carry trade in the first place — it buys time while the imbalance underneath keeps growing. Policymakers are trying to hold the yen inside an almost impossible range: weak enough to keep the carry trade, and the dollar demand for US assets it generates, intact; strong enough to avoid a genuine Japanese currency crisis. Every successful intervention preserves the exact leverage that made the intervention necessary in the first place — which is precisely the shape of a problem that gets larger with every round, not smaller.
The consequence, when intervention eventually stops being sufficient rather than just needing another top-up, is a hard unwind on two fronts at once: investors who borrowed cheap yen for years to fund US tech and AI-adjacent positions get forced to sell those positions to repay yen loans that have suddenly gotten far more expensive, at the same time Japan itself may be liquidating Treasuries to keep defending its own currency. Carry-trade unwind, Treasury selling, and US risk-asset liquidation, arriving together rather than politely taking turns.
There’s a final step worth naming explicitly, because it closes the loop back to this essay’s central argument rather than sitting alongside it as a separate Japan story. Once currency intervention stops being enough, the documented next move for an overstretched sovereign is for intervention to shift from the currency market to the bond market directly — central banks buying government debt outright to suppress yields, which is yield curve control by another name. The pressure doesn’t get eliminated by intervening. It gets moved: from yen, to euro, to Treasuries, to central bank balance sheets. Every round makes the system more expensive to stabilize, not less — and “more expensive to stabilize” is a fair one-line summary of everything this essay is arguing about the Fed’s own position, not just Japan’s.
Part Four: Where It Cracks First
Every cycle needs a proximate trigger, and my read is that private credit is furthest along.
The reassurances are already out there, and they should sound familiar to anyone who’s lived through a cycle before. gamesblazer06 skewered them well: private credit and private equity have tons of “dry powder.” Banks are in great shape. It’s really hard for anything to go really wrong. Tell me you haven’t seen the ’90s Tech Wreck without telling me you haven’t seen the ’90s Tech Wreck.
Six major business development companies gated redemptions between November 2025 and April 2026 — Blue Owl, Morgan Stanley’s North Haven, BlackRock HPS among them. The share of payment-in-kind interest in the private credit market — borrowers paying their interest with more debt rather than cash — has roughly doubled. Meanwhile, bank lending to non-depository financial institutions has grown 84% since October 2024, more than three times the combined growth of every other lending category, and now accounts for 14.3% of total bank lending versus 8.6% eighteen months earlier. Some of that headline number is an accounting artifact — a portion of it is banks reclassifying existing loans into the category rather than pure new lending, and the data shows a visible step-change around the turn of the year that’s consistent with exactly that. But even stripping the reclassification out, the growth in every other lending category over the same window was $90 billion or less. The direction is real even if the magnitude is inflated.
There’s a lead-lag relationship worth knowing here too. Historically, bank surveys reporting tighter lending standards have preceded — not coincided with — blowouts in CCC-rated high yield spreads, both in 2001 and 2008. If banks are already telling surveyors they’re tightening standards, that’s traditionally a signal spreads have further to widen, not evidence the widening has already happened.
Layer on the leverage building in adjacent corners of the system. Hedge fund net repo borrowing and the money-market-fund lending that finances it have both climbed toward $2 trillion in cumulative change since 2014, sharply since 2023 — leverage built largely on the Treasury cash-futures basis trade, a well-known systemic vulnerability that blew up briefly in March 2020. SOFR has traded above IORB — a signal of funding scarcity — for three straight quarters now. None of these are, individually, a crisis. Together, they’re the kind of background hum that preceded the last several genuine ones.
Part Five: Why They Won’t Let the Wealth Effect Reverse
The mechanical case is that the Fed gets forced into preventing a real reversal. There’s a separate, complementary case that they’d choose to prevent it anyway, and it’s worth keeping the two distinct rather than blurring them together.
Since the March 2020 low, the wealth effect the stock market has created is, in my view, now large enough that letting it reverse is close to a policy non-starter. The Buffett Indicator — total US market value over GDP — sits around 245%, 2.6 standard deviations above trend, using Federal Reserve data going back to 1950. For context: Warren Buffett himself called a 200% reading “playing with fire” when describing the dot-com peak. We are not approaching that warning level. We are roughly 45 points past it. All else equal, a reversion to something like fair value implies a decline in the neighborhood of 20%, or roughly $15 trillion — about 47% of nominal US GDP, vaporized. That is not a market correction. That is a macroeconomic event, and it’s the kind of number that explains why “price discovery” stopped being a serious policy option a long time ago.
There’s a second-order piece to this that matters for who bears the cost of letting it run, or of stopping it. The K-shaped economy — asset owners doing well, everyone else falling behind — didn’t happen by accident. It’s a direct byproduct of the post-2008 regime: people with access to capital and credit benefited from the asset-price inflation that regime created, while savers and people without assets to begin with did not. Powell himself once described inequality as “a gradually moving phenomenon” — which is true in the sense that it moves slowly, and beside the point in the sense that the direction of travel has been entirely one way for fifteen years. There’s a specific, current symptom of this worth naming: recent survey work finds a quarter of men aged 18-29 now trade stocks daily, with nearly two-thirds of them reporting they feel like failures — a generation locked out of the traditional path to wealth (a house, a pension, a career ladder) and speculating as something closer to a last resort than an opportunity. That’s not “easy money.” That’s what happens when the system’s main wealth-building mechanism becomes financial-market participation rather than earned income — and people with no capital go looking for some anyway, any way they can find it.
Part Six: The Honest Counter-Case
I’d rather take the strongest version of each objection seriously than pretend they don’t exist.
“The reserves-to-asset-prices link is spurious.” This is the sharpest version of the pushback, and I’ve had it made to me directly. Ben Bernanke, defending QE while he was still Fed Chair, described the actual mechanism plainly: central bank purchases of safe assets push investors out along the risk curve. Buy up the Treasuries everyone wants to hold, and the investors who used to hold them go looking for yield somewhere riskier — corporate credit, then equities. That’s not a theory I’m reaching for. It’s the Fed’s own stated explanation for why QE was supposed to work in the first place. Within the post-2008 ample-reserves era, the relationship holds up under multiple, independent tests too — in raw levels, and separately in year-over-year percentage change on both series simultaneously, tested more than once, months apart. That’s real robustness, but it’s robustness within one regime, not across regimes. The pre-2008 evidence I have is for reserves against the dollar, not reserves against equities, and there’s a good reason I shouldn’t stretch it to cover stocks: before 2008 the Fed ran a scarce-reserves corridor system, where reserve balances were kept deliberately minimal just to hit the fed funds rate target. Reserve quantity wasn’t a meaningful policy signal at all until the post-2008 ample-reserves regime made it one — so there’s no real mechanism by which pre-2008 reserve levels should have moved stock prices, and I’m not aware of evidence that they did. The fair version of this defense: the reserves/SPX relationship is well-tested within the regime where it has a plausible mechanism, backed by the Fed’s own account of how QE transmits — not proven to be timeless.
“Fed easing doesn’t stop a risk-averse collapse.” John Hussman has made this case pointedly, citing 2000-2002, when the Fed eased aggressively throughout an 83% decline in the Nasdaq 100. He’s right about that episode, and the honest response is to explain why it’s a different kind of episode than the one this essay is describing. 2000-2002 was a pure valuation and earnings collapse, with no funding-market blockage for the Fed to unclog — there was nothing to grease, so greasing didn’t help. The pattern this essay is betting on is different: a funding-event trigger — Treasury market dysfunction, private credit forced selling, a repo blowup — which is precisely the category where central bank liquidity has a real, repeated track record: 2008, the 2019-20 repo-to-COVID sequence, and March 2023, when the Fed stood up the Bank Term Funding Program within days of Silicon Valley Bank’s collapse, letting banks avoid realizing losses on underwater Treasury holdings — a QE-adjacent tool, deployed in the middle of an active hiking cycle, the moment something in the plumbing actually broke. The honest caveat: if the eventual trigger turns out to be a slow, earnings-driven grind lower instead of a discrete funding event, the “Fed rides in and fixes it” mechanism is considerably less reliable, and Hussman’s objection gets its teeth back.
“America can’t run the Japan playbook.” This is the objection I take most seriously, and it deserves real weight rather than a footnote. Japan can suppress rates below inflation and slowly inflate its debt burden away because it controls its own creditors — the Bank of Japan holds 48% of JGBs, domestic institutions hold most of the rest, and foreigners hold just 8%. When Tokyo pins rates down, the losses land on captive domestic buyers who have nowhere else to go. America can’t run the identical play, because foreigners hold 31% of US public debt — $9.2 trillion — and the US net international investment position is roughly minus $21 trillion, versus Japan’s plus ¥562 trillion. And we’ve already run the experiment: in 2021-22, as inflation ran hot, US debt-to-GDP actually fell from 133% to 119% — the mechanism working, briefly. Then foreign holders did what a captive domestic base can’t: they sold, and demanded more yield to keep holding. The 10-year crossed 5% in October 2023 for the first time since 2007. Higher rates on every subsequent auction ate the gains. The ratio is back above 126% and climbing. This doesn’t kill the thesis. It reframes it: expect a messier, less clean version of financial repression than Japan’s, with the dollar’s reserve-currency status doing some of the work Japan’s captive creditor base does for it — but it’s a genuine reason the endgame here looks noisier and less controlled than the postwar or Japanese precedents.
Warsh himself is on record against the entire premise of this essay. He has said, repeatedly and on camera, that he has “no tolerance” for above-target inflation, that the 2% target is “absolute,” and he has explicitly warned households and markets not to read five years of above-target inflation as Fed tolerance. Current policy backs the rhetoric up, for now: rates held at 3.50-3.75% in July with three dissents favoring a hike, not a cut, against core PCE that accelerated from 3.0% in December to 3.4% in May before easing slightly to 3.3% in June. July’s CPI report, released last week, told a similar story: headline inflation eased to 3.4% from 3.5%, core CPI to 2.5% from 2.6%, both moves driven mainly by falling energy prices. Worth being precise about why energy eased, because it’s the whole ballgame for whether this softening holds: prices fell on the back of a ceasefire between the US and Iran, and every economist covering the report flagged it as a probable one-off rather than a trend — the ceasefire is fragile, the war isn’t formally concluded, and a re-escalation puts the energy-led disinflation into reverse just as quickly as it arrived. This is one data point, not a rebuttal, and it cuts in an interesting direction for this essay’s argument either way: if oil stays down and inflation keeps easing on its own, that’s less pressure forcing Warsh’s hand — but a durable disinflation was never really the risk this essay is describing. The risk is a funding-market event, and nothing about a softer CPI print changes the mechanical case laid out in Parts Two through Four. I don’t think the inflation objection is decoration, regardless of which way the next few prints go. I think it’s the second half of a pattern this essay’s entire mechanism section is built on: Warsh has now made two public commitments — a smaller balance sheet, and zero tolerance for above-target inflation — and the thesis here is a bet that both break under the same structural pressure, the way “not QE” broke in 2020. That’s a stronger, more testable claim than “the Fed will print.” If Warsh actually holds both lines through a genuine funding-market stress event, this essay is wrong, not just early.
Other genuine complications, briefly: stablecoins are a real and growing source of Treasury bill demand under the GENIUS Act, but they remain an unproven offset — the KC Fed’s own research is skeptical it nets out to as much new demand as advertised, since it partly displaces money-market and bank-deposit holdings rather than creating demand from nothing. It’s a “prove me wrong” category, not a load-bearing counterargument. And on the supply side, easing bank capital rules alone — the SLR relief this essay’s mechanism section leans on — may not be sufficient by itself. Professional analysis of actual bank Treasury purchases by tenor since 2022 finds regulatory relief hasn’t yet been enough to generate the duration demand the market needs, which is itself an argument for why the Fed ends up as the buyer of last resort rather than banks quietly absorbing the supply on their own.
Part Seven: Where This Actually Goes
Here’s where I want to be precise about what I’m arguing, because it’s not simply “gold goes up.”
The claim has three parts. First: they’re already doing it. Small-scale, technically-justified, “not QE” reserve management purchases are quantitative easing by any definition that doesn’t hinge entirely on the word “large.” Second: this escalates. Not necessarily to 2020-style QE infinity on day one, but through some combination of larger-scale asset purchases, yield curve control, and financial repression more broadly — using regulatory authority to expand the pool of captive buyers for government debt, the way Basel III and SLR relief already quietly do. The Committee for a Responsible Federal Budget itself lays out exactly this menu — lower rates, yield curve control, financial repression, “or all of the above” — as the realistic alternative to outright default or genuine austerity, and there is a direct historical template: after World War II, the Fed explicitly capped Treasury yields below the rate of inflation to manage the war debt, until the 1951 Accord ended the arrangement. Third, and this is the part that actually matters for how you should think about your money: real assets and asset markets broadly re-inflate as a consequence, and higher-for-longer inflation gets tolerated — quite possibly, at the margin, even encouraged — specifically because it keeps real rates low enough to make the debt shrink in real terms. Volcker’s disinflation only became possible once the 1970s had already inflated debt-to-GDP down from roughly 100% to roughly 30% — you inflate first, and you only get to raise rates and kill inflation once the debt burden has already been quietly reduced. That’s the actual mechanism for “solving” a debt problem that cannot realistically be grown out of or taxed away, and it’s a documented historical playbook, not a novel prediction.
Gold and hard assets are a symptom of this regime, not the argument itself, and as it happens the symptom is already visible: gold made new highs earlier this year, and the dollar has stayed comparatively resilient against other major currencies over the same stretch — a “dollar smile” pattern where the currency holds up cross-rate even as it weakens hard against real assets specifically, which is precisely the divergence this essay’s framework would predict, already showing up before the main event arrives.
Part Eight: What I Know, What I Make of It, What I’m Watching
What I know: the deficit is running hotter than the administration’s own projections, interest expense is compounding faster than revenue, the Fed is already buying bills every month while insisting it isn’t easing, private credit is visibly cracking, and every developed-market government bond curve is under the same kind of pressure at the same time.
What I make of it: this doesn’t resolve through growth, and it doesn’t resolve through the political will to run a genuine surplus, because neither exists. It resolves through some combination of asset purchases, curve management, and tolerated inflation — the toolkit every overleveraged sovereign reaches for once the alternatives run out, deployed with whatever technical justification preserves the fiction that it isn’t what it is.
What I expect: the trigger is more likely to be a funding-market event — something in private credit, repo, or Treasury-market liquidity specifically — than a slow-motion earnings recession, because that’s where the pressure is visibly building right now, and it’s the category where the Fed’s toolkit has a real, repeated track record.
What would change my mind: if Warsh actually holds both lines — a genuinely shrinking balance sheet and zero tolerance for above-target inflation — through an actual funding-market stress event, rather than through calm conditions where holding the line costs nothing. That’s the real test, not a press conference.
The balance sheet grew $200 billion in the six months after the man running it said he wanted it $3 trillion smaller. That’s not proof of anything on its own. It’s just the tell.
Postscript, August 25, 2026: The Buybacks, the TGA, and Druckenmiller
This essay published a week before three things happened that belong here rather than in a separate piece, because together they’re the closest thing to a real-time confirmation this framework has had since publication — even though, to be precise about it, none of the three involves the Fed’s own balance sheet at all.
On August 19, Treasury doubled the size of its long-dated buyback operations — 10-to-30-year paper — from roughly $2 billion to at least $4 billion per operation, running through November 4. The stated rationale, in Treasury’s own press release, is “greater liquidity support in longer-dated nominal sectors.” Five days later, on August 24, reporting emerged that Scott Bessent is weighing tapping the roughly $950 billion sitting in the Treasury General Account — well above the historical $550-600 billion norm — to help fund those buybacks, rather than raising the cash through fresh bill issuance alone.
Worth being exact about what this is and isn’t. This is Treasury’s own debt-management operation — bond buybacks funded through the TGA and bill issuance — not the Fed’s balance sheet mechanics that Part One of this essay is built around. They’re different institutions doing different things for different stated reasons. But the instinct underneath both is the one this essay opened by naming: using an existing pool of cash to suppress a price signal, while insisting that isn’t what’s happening. Spend the TGA down on buybacks and it has to be rebuilt — through more debt issuance, into a deficit already running ahead of last year’s total (see Part Two). More issuance is exactly the pressure Part Three describes building in the Treasury market, and Treasury market disruption is the threshold I’ve written about since October 2022 as the point past which the Fed stops pretending and does whatever it takes.
Then, on August 25, Stanley Druckenmiller published a WSJ op-ed — “Let the Bond Market Speak” — that names the same distinction this essay leans on throughout, using almost the same words. “This wasn’t liquidity management,” he wrote, “it was price management.” And on what a market-clearing 30-year yield would actually mean: “If the 30-year must trade at 5.5% to clear, that isn’t a crisis. It is an invoice.” Druckenmiller isn’t reacting to anything here — he arrived at the same diagnosis independently, from a very different vantage point, aimed specifically at Bessent’s buyback program rather than the Fed. But it’s the same argument this piece opened with in February: killing price discovery through repression is still repression, whichever agency is doing the repressing and whatever they call it.
None of this proves the larger thesis. It’s one week, one program, one op-ed. But it’s the kind of week this essay predicted would keep happening, for exactly the reason it gave.